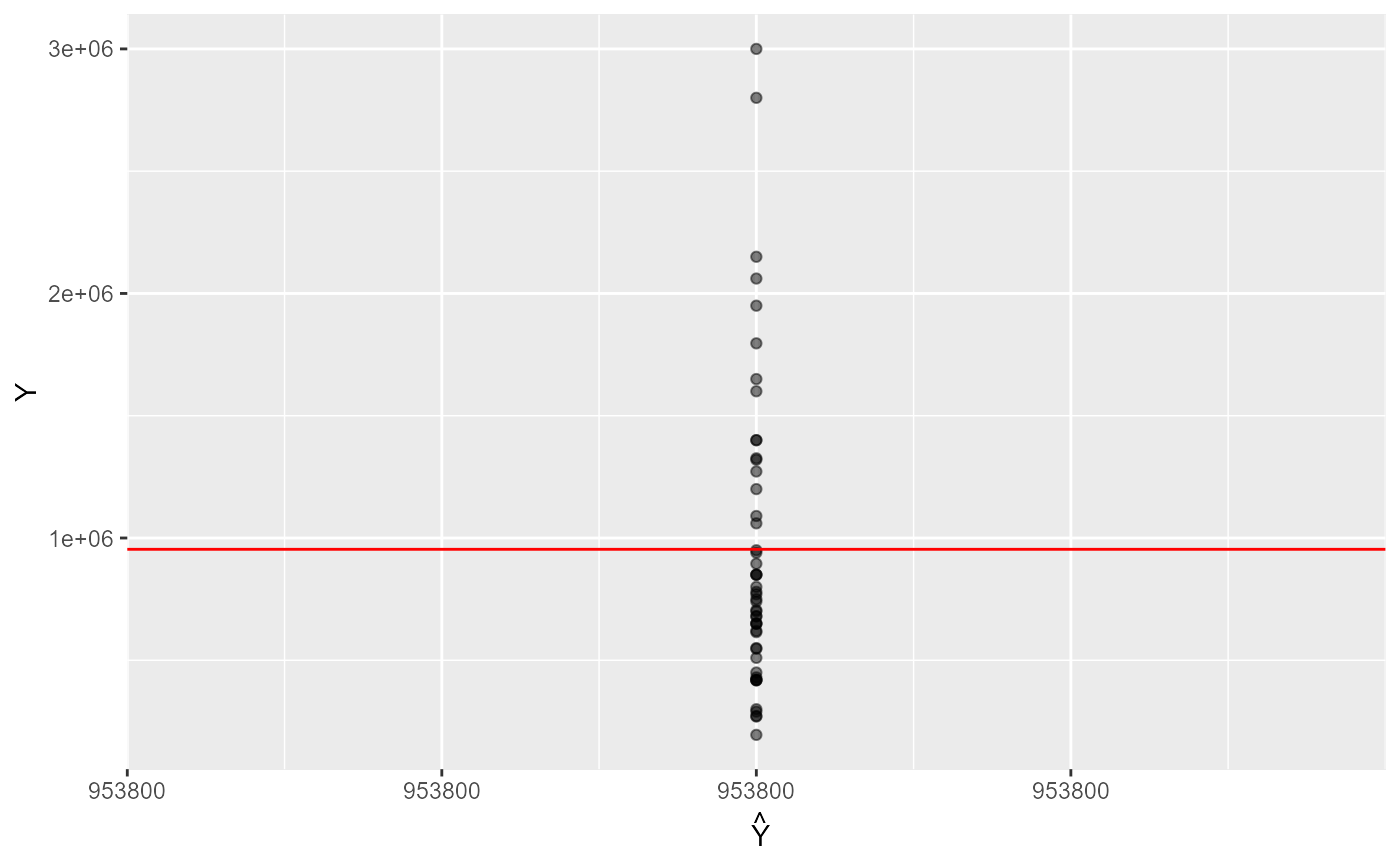
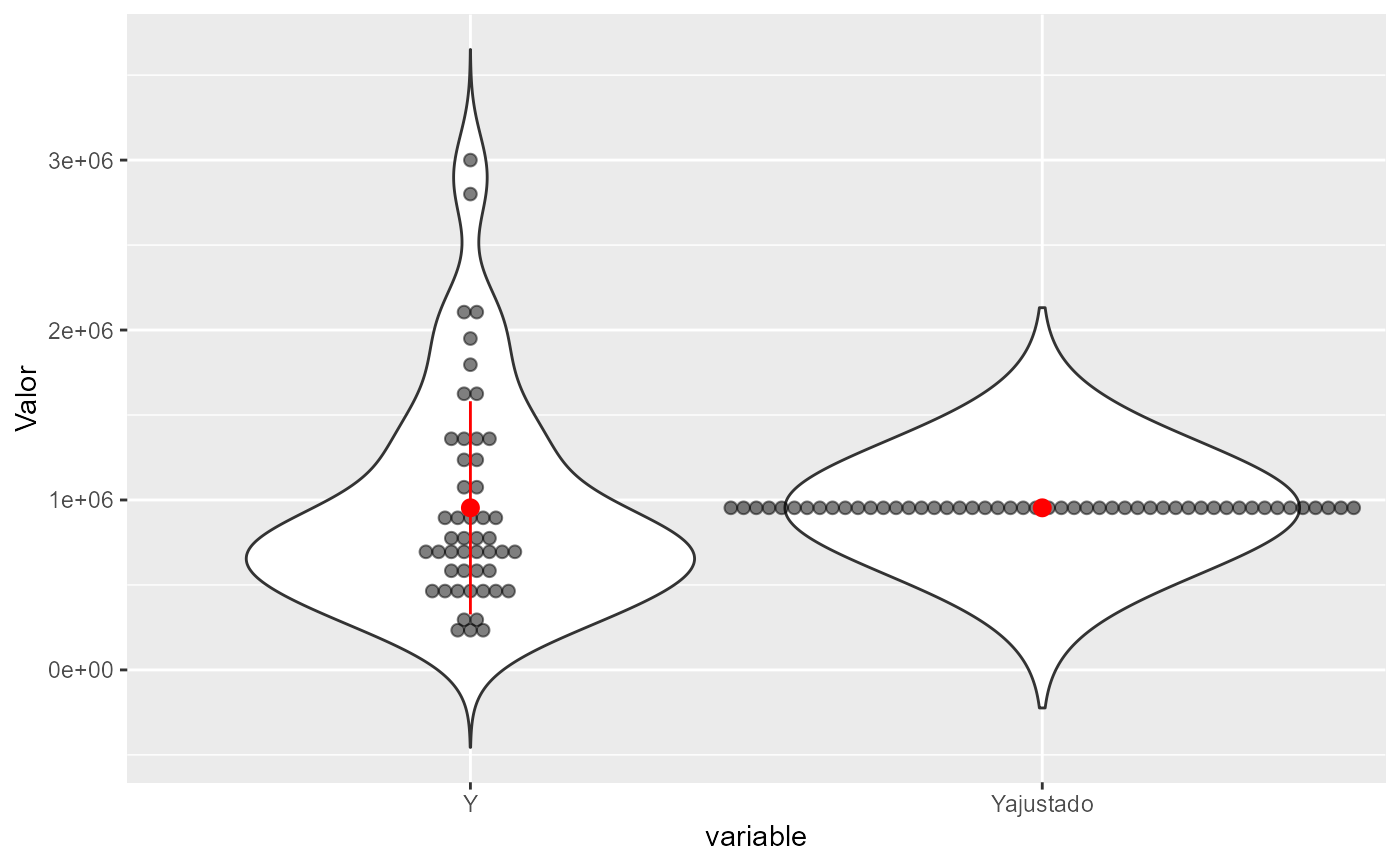
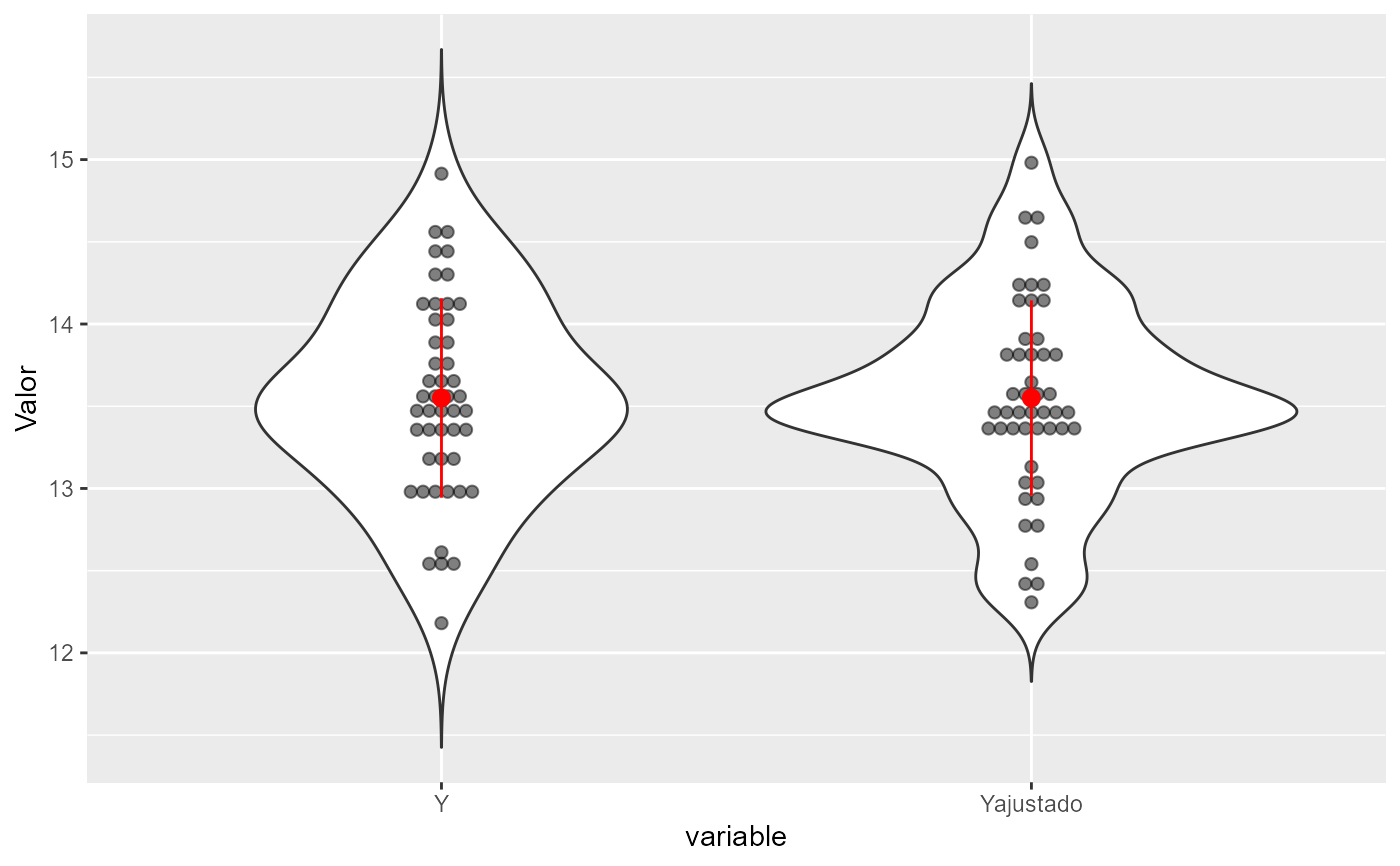
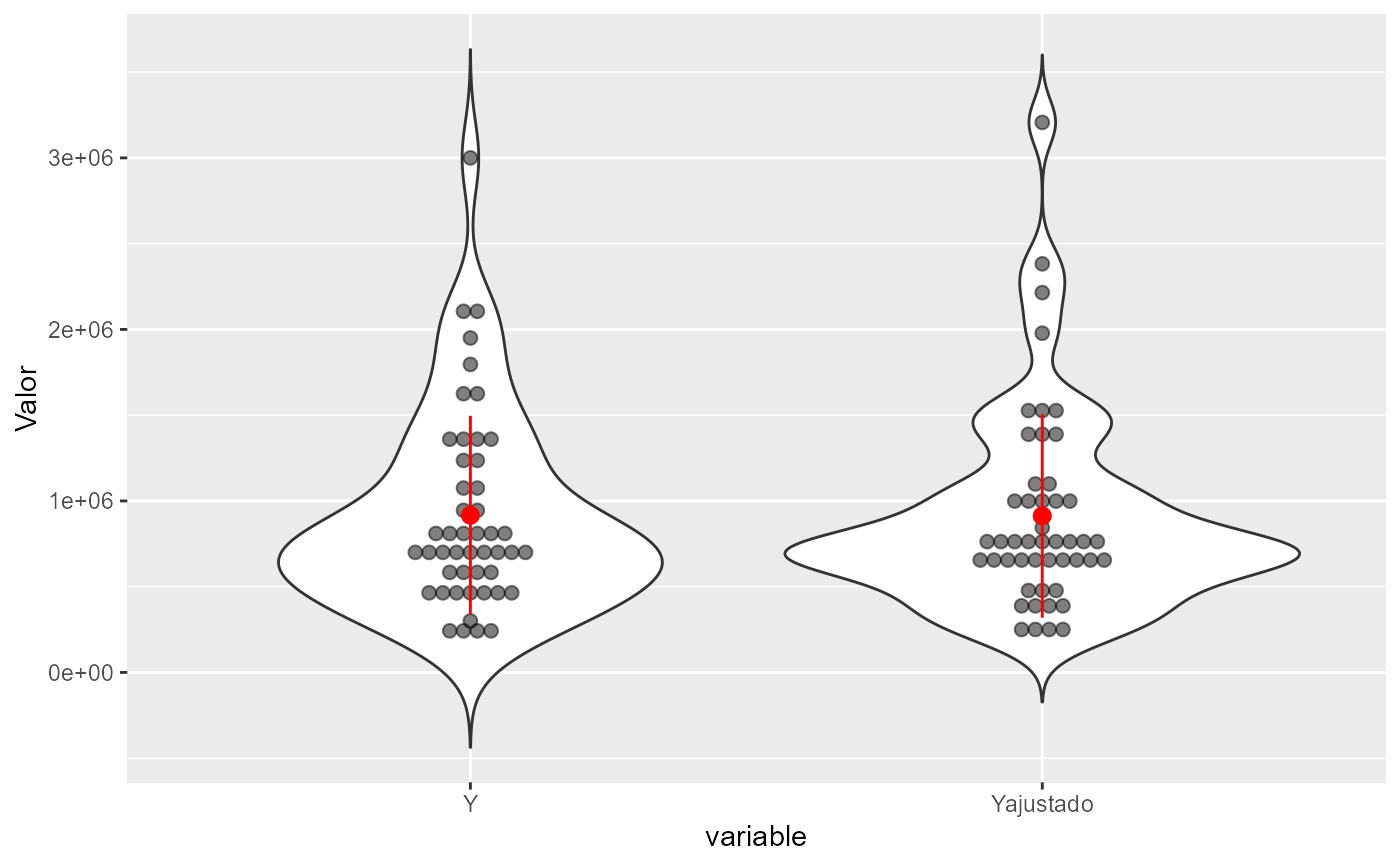
Computes fitted values from lm package and plots aside of observed values
shrinkPlot(object, func = "identity", ...)
Arguments
| object | object of class |
|---|---|
| func | function used to transform the response (defaults to identity) |
Value
a shrinkage prediction plot
Examples
library(sf) dados <- st_drop_geometry(centro_2015) fit0 <- lm(valor ~ 1, dados) powerPlot(fit0, axis = "inverted")#>#> Warning: prediction from a rank-deficient fit may be misleadingshrinkPlot(fit0)#>dados$padrao <- as.numeric(dados$padrao) fit <- lm(log(valor)~area_total + quartos + suites + garagens + log(dist_b_mar) + I(1/padrao), data = dados, subset = -c(31, 39)) shrinkPlot(fit)#>shrinkPlot(fit, func = "log")#>